
B2B SEO reporting isn’t just about tracking rankings or traffic – it’s about proving how SEO drives business growth. With complex sales cycles involving multiple decision-makers, traditional metrics often fall short. This guide breaks down the most important metrics to focus on, from visibility and engagement to pipeline and revenue attribution. Here’s what you need to know:
- Visibility Metrics: Track organic impressions, search visibility, and Share of Voice (SOV) to measure your brand’s online presence.
- Engagement Metrics: Monitor click-through rates (CTR), bounce rates, dwell time, and pages per session to assess content performance.
- Conversion Metrics: Focus on Marketing Qualified Leads (MQLs), Sales Qualified Leads (SQLs), and MQL-to-SQL conversion rates to measure lead quality.
- Pipeline & Revenue Metrics: Analyze qualified pipeline value, win rates, and revenue attribution to tie SEO efforts directly to financial outcomes.
- Technical Metrics: Optimize Core Web Vitals (LCP, INP, CLS) and backlink growth by following an SEO audit checklist to improve site performance and authority.
The goal? Move beyond surface-level data and align SEO reporting with business objectives. By focusing on metrics that matter – like pipeline contribution and revenue – you can demonstrate SEO’s true impact on your bottom line.
Visibility Metrics
Visibility metrics reveal how often B2B buyers come across your brand online. They’re crucial because 88% of B2B buyers research online before deciding on a purchase, and 60% kick off that research on Google. On average, a B2B buyer conducts 12 online searches and goes through 13 pieces of content before ever contacting a vendor. If your brand isn’t present during this discovery phase, you’re out of the running before the conversation even starts. These metrics help you measure and understand your search presence.
Organic Impressions and Search Visibility
Organic impressions track how many times your site appears in search results. Think of this as a forecasting tool – it indicates future opportunities before traffic or conversions show up in your analytics. As Calum Whittingham, Organic Search Consultant at Hallam, explains:
"Tracking visibility for problem, solution, and product terms forecasts future pipeline better than isolated rankings."
This is especially important now, with Google’s AI Overviews showing up in 15-20% of search queries. In today’s world of zero-click searches, impressions serve as an early measure of brand awareness.
To get a full picture, track a weighted visibility score:
Visibility Score = Σ(Keyword Volume × Position-Based CTR × Market Share) / Total Market Opportunity.
This formula gives a comprehensive view of your presence across thousands of keywords, rather than focusing on a few rankings. Aim for a 10% monthly growth in organic keyword visibility.
Share of Voice (SOV)
Share of Voice measures the percentage of organic search visibility your brand owns within a specific keyword market. Unlike tracking individual keyword rankings, SOV offers a broader perspective on your competitive standing. If your brand owns 30% of search visibility in your niche, you’re likely positioned to capture a similar share of deals.
To calculate SOV, use this formula:
(Sum of (Your Keywords × Search Volume × CTR) / Total Available Traffic) × 100.
This method ensures high-volume keywords weigh more heavily than less-searched terms.
SOV also highlights gaps where competitors dominate. Focus on filling these gaps based on relevance and potential for conversions. Break down SOV by informational, commercial, and transactional keywords to see where your visibility holds the most value.
Keyword Rankings and SERP Features
While individual keyword rankings have limitations due to personalization and AI-driven results, they’re still valuable when analyzed in aggregate and grouped by intent. Organizing keywords by topic allows you to monitor rank changes and build topical authority over time.
Another critical area to track is your ownership of SERP features like Featured Snippets, People Also Ask boxes, and Local Packs. These elements can account for 35-45% of clicks on target queries. Winning a Featured Snippet, for instance, can draw traffic away from the #1 organic spot and significantly boost your click-through rate.
Use tools like Semrush, Ahrefs, or AccuRanker to monitor SERP features in real time. Set up alerts for major rank shifts or the loss of a Featured Snippet, so you can respond quickly. As Julia Kranz, Senior Content Marketing Manager at Seobility, points out:
"AI search is changing the way online searches work. Looking only at actual traffic no longer gives you a complete picture of how your content contributes to your company’s success."
sbb-itb-7a53647
Engagement Metrics
Once users land on your site, engagement metrics help reveal how well your content and site experience resonate with them. These metrics provide insights into whether your content aligns with what B2B buyers are seeking and if your site can hold their attention. Jeffrey Barroga from Paxful sums it up well:
"CTR is the best indicator of how well your page matches the searcher’s intent."
Click-Through Rate (CTR)
CTR tracks the percentage of users who click on your listing and reflects how well your meta titles and descriptions align with user intent. Did you know the top three Google search results capture nearly 70% of all clicks? Meanwhile, listings on the second page often struggle with CTRs below 1%. Featured snippets, however, shine with an impressive average CTR of 43%.
If your CTR is low despite good rankings, something’s likely off. Your meta titles and descriptions might not be clear or enticing enough. Experiment with updated meta tags to better communicate the value of your content.
Bounce Rate and Dwell Time
With Google Analytics 4, there’s been a shift from focusing on bounce rate to engagement rate – a more positive measure of content quality. A session is considered "engaged" if the user stays longer than 10 seconds, views a second page, or completes a conversion. For B2B websites, an engagement rate above 63% is a strong indicator of success.
Traditional bounce rate still holds value, with a healthy benchmark for B2B sites hovering around 39%. High bounce rates often signal that your content isn’t meeting user expectations. Jack Choros from Iron Monk explains:
"Usually you only get one or two clicks to get a user’s attention in order to get them onto your website. If they instantly leave it tells you that your landing page or homepage isn’t compelling enough."
Dwell time, or the time users spend on your page before returning to search results, is another key metric. Quality content typically keeps users engaged for 2 to 4 minutes. If users spend only a few seconds on a long article, it’s a red flag that your content isn’t meeting their needs. Search engines use this data to evaluate how well rankings align with user intent.
To improve these metrics, tailor your content to the user’s position in the buying journey. For example, avoid pushing users in the research phase directly to a hard-sell product page. Including multimedia elements like images and videos can also make your content more engaging.
Pages per Session
Pages per session measures how many pages visitors view in a single visit, offering another layer of insight into user engagement. A successful B2B site typically averages 2.2 pages per session. Higher numbers suggest your site effectively guides visitors deeper into your content and sales funnel. On the flip side, low pages per session may point to weak internal linking or unclear navigation. Every page should naturally lead visitors to related topics, improving both engagement and authority distribution.
| B2B Engagement Metric | Success Benchmark |
|---|---|
| Engagement Rate | >63% |
| Bounce Rate | 39% |
| Average Session Duration | 3:36 |
| Pages Per Session | 2.2 |
| Organic CTR (1st Page Avg) | 9.8% |
To identify areas for improvement, monitor your top exit pages – these are where users tend to lose interest. Adjustments like clearer calls-to-action, better content flow, or improved internal linking can help address these issues. As Evan Bailyn from First Page Sage puts it:
"Traffic is only useful when it converts to leads for your sales team, making conversion rate optimization an important element of successful SEO campaigns."
Conversion and Lead Metrics
Engagement metrics might tell you how much interest your site generates, but conversion and lead metrics reveal if your SEO efforts are actually driving business growth. These metrics connect your SEO strategies directly to revenue. As SalesHive puts it:
"If your CRM can’t show opportunities and revenue tied to Organic Search, you don’t have an SEO problem – you have a measurement problem."
Here’s a telling statistic: Organic search accounts for about 53% of all inbound B2B leads, with a close rate of 14.6%. That’s nearly nine times higher than the 1.7% close rate for traditional outbound leads. Organic traffic also converts at around 2.5%, compared to 1.3% for paid traffic. Understanding how these leads are classified and qualified is the next step.
Marketing Qualified Leads (MQLs) from Organic
Marketing Qualified Leads (MQLs) are potential customers who have shown genuine interest, setting them apart from Sales Qualified Leads (SQLs). Seth Nagle of LZC Marketing explains:
"MQLs are marketing qualified leads who are interested in your product… This intent distinguishes between MQL and SQL."
For organic search, MQLs often come from actions like signing up for newsletters, downloading gated content, or registering for webinars. To correctly track these leads, ensure your CRM uses a clear lead source taxonomy, tagging them as "Organic Search" instead of generic categories like "Website" or "Other" .
It’s also important to monitor both "SEO-sourced" leads (initiated by organic search) and "SEO-assisted" leads (where organic search plays a role in a multi-touch journey). Educational content, such as blog posts, often supports conversions by guiding prospects through their research process.
Using GA4 event tracking, you can follow specific actions like form_submit or file_download to measure conversions. Ideally, around 30% to 50% of your total leads should qualify as MQLs. If your traffic is high but MQL numbers are low, your content might not be resonating with your ideal customer profile.
Sales Qualified Leads (SQLs) from Organic
While MQLs show interest, SQLs are the leads your sales team identifies as ready for direct engagement. These often come from high-intent actions, like demo requests or pricing inquiries. Despite 61% of marketers citing lead generation as a major challenge, the real hurdle is generating leads that are ready to buy.
To pinpoint SQLs from organic traffic, integrate tools like HubSpot or Salesforce with your CRM to track leads from their first organic interaction to a closed deal . Segmenting organic performance by intent – such as informational, comparison, or bottom-of-funnel – can be more effective than focusing solely on individual keywords . Pages with high intent, like pricing or demo request pages, tend to generate more SQLs than general educational content.
You can also enable high-intent alerts for key accounts visiting important organic pages, allowing sales reps to act quickly. Including qualifying questions (e.g., company size, budget, or job title) on landing page forms can streamline the MQL-to-SQL shift. Lead scoring models, which can improve lead generation ROI by up to 77%, are another powerful tool.
Lead Quality and MQL-to-SQL Conversion Rate
Generating a large volume of leads is great – until it overwhelms your sales team. A solid MQL-to-SQL conversion rate typically falls between 25% and 35% in B2B settings, though some benchmarks suggest 13% as a baseline . If you’re seeing plenty of MQLs but few SQLs, your content strategy might be targeting the wrong audience. As Calum Whittingham from Hallam points out:
"If you are generating hundreds of MQLs but zero SQLs, your content strategy may be targeting the wrong keywords or intent, which in turn results in less buyers."
Lead quality is often assessed using two scores: a Fit Score (based on demographics like industry or company size) and an Engagement Score (based on actions like visiting a pricing page). For instance, visiting a high-intent page might add 10–15 points, while matching your ideal customer profile could add 15–20 points. On the flip side, using a personal email address (e.g., Gmail) in a B2B context might subtract 5–10 points.
Data-driven approaches are key here – companies using them are six times more likely to see year-over-year profitability. Regular audits, like "Keep, Kill, Upgrade", can help you weed out vanity metrics and focus on those that drive meaningful results. If your MQL-to-SQL conversion rate is lagging, revisit your content strategy to ensure it aligns with your product and target audience. The goal is to produce leads that convert into paying customers.
Pipeline and Revenue Metrics
Leads are one thing, but showing how SEO drives pipeline and revenue is what gets executive teams on board. Beyond just conversion rates, these metrics highlight how organic performance directly impacts financial outcomes.
Qualified Pipeline Generated
This metric tracks the total dollar value of sales opportunities where organic search played a role in influencing buyer decisions. It’s not just about the number of leads – it’s about identifying high-value opportunities and proving that SEO contributed to creating them.
To do this, integrate your CRM with analytics tools to map a visitor’s journey from their first search to a closed deal. Be sure to differentiate between "SEO-sourced" opportunities (where organic search was the first touchpoint) and "SEO-assisted" opportunities (where organic search played a role at any point before the deal closed). Both are important: sourced pipeline reflects your ability to generate new demand, while assisted pipeline shows how SEO supports the entire buyer journey. This aligns with multi-touch attribution, reinforcing SEO’s impact on long sales cycles.
A clean lead source taxonomy in your CRM is essential. Make sure every form, chat widget, and scheduler tags leads as "Organic Search" instead of using vague labels.
Since the average B2B sales cycle spans about four months and involves 60 digital touchpoints, cohort-based reporting is key. This allows you to connect SEO efforts in one quarter to revenue generated in later months. For enterprise deals, which often involve multiple stakeholders, consolidate organic touchpoints at the account level for a clearer view of how SEO influences buying committees.
Win Rate and Sales Velocity
Win rate measures the percentage of SEO-influenced opportunities that close, while sales velocity shows how quickly deals move through your pipeline. Together, these metrics indicate whether your organic traffic is attracting the right buyers – not just any buyers.
Once you’ve established pipeline value, it’s crucial to assess how effectively and quickly these opportunities convert.
On average, SEO-sourced leads close at a rate of 14.6%, compared to just 1.7% for traditional outbound leads. If your win rate for organic leads is falling short of this benchmark, it might signal that your content isn’t resonating with your target audience.
Here’s the formula for pipeline velocity:
Pipeline Velocity = (Opportunities × Average Deal Value × Win Rate) / Sales Cycle Length.
This metric shows how quickly SEO-driven opportunities are progressing toward becoming closed deals. SEO-sourced deals often close faster because buyers are typically better informed.
Set up high-intent alerts in your analytics to flag when known accounts visit pricing or demo request pages via organic search. These signals can be escalated to sales teams to speed up the closing process. Additionally, tracking high-intent pages (like pricing and demo requests) separately from informational blog content can provide insights into their direct impact on win rates and sales velocity.
Pipeline Contribution and Revenue Attribution
Attribution is a common pain point – 56% of B2B marketers report challenges in tracking customer journeys and assigning ROI. Relying solely on last-click attribution underestimates SEO’s role in multi-touch journeys.
For B2B SEO, a position-based (U-shaped) attribution model is often the most effective. This model assigns 40% of the credit to the first touch (awareness), 40% to the last touch (conversion), and splits the remaining 20% across middle touchpoints. Alternatively, data-driven attribution (DDA), which uses machine learning to assign credit based on actual performance, often reveals that SEO’s multi-touch contribution is 2–5× higher than what last-click models suggest.
To demonstrate SEO’s revenue contribution, calculate your SEO ROI using this formula:
(Revenue from SEO – Cost of SEO) / Cost of SEO.
Then, compare this against other channels using metrics like cost per opportunity. Top-performing B2B companies aim for a 3:1 ratio of Customer Lifetime Value to Customer Acquisition Cost.
Finally, segment your reporting by intent. For example, track how informational blog posts, comparison pages, and transactional pages each contribute to pipeline and revenue. Interestingly, low-traffic comparison pages can often generate more revenue than high-traffic blog posts, helping you decide where to focus your future content efforts.
Technical Performance Metrics
Pipeline revenue and qualified leads hinge on having a fast, efficient website. Technical performance metrics help determine whether your site’s infrastructure is supporting or undermining your SEO efforts. These metrics directly impact both search rankings and conversion rates, making them essential for evaluating your site’s overall performance.
Page Speed and Core Web Vitals
Google evaluates user experience through Core Web Vitals, a set of real-world metrics that measure how your site performs in loading speed, interactivity, and visual stability. These metrics are critical ranking factors that influence whether your site outranks competitors.
The three key metrics include:
- Largest Contentful Paint (LCP): Tracks how quickly the main content of a page loads. A "good" score is 2.5 seconds or faster.
- Interaction to Next Paint (INP): Set to replace First Input Delay in March 2024, this metric measures responsiveness throughout a user’s visit. A "good" score is 200 milliseconds or less.
- Cumulative Layout Shift (CLS): Measures visual stability by tracking unexpected layout shifts. A "good" score is 0.1 or lower.
Improving these metrics can enhance both rankings and user engagement. Google evaluates Core Web Vitals at the 75th percentile of page loads, meaning most visitors should experience a "good" user experience.
B2B websites often face challenges with Core Web Vitals due to elements like marketing automation scripts, CRM integrations, lead capture forms, and chat widgets. A sluggish site not only hurts rankings but can also damage the professional credibility needed for extended B2B sales cycles. Tools like Google Search Console’s Core Web Vitals report and a technical SEO audit can help identify problem areas, especially for high-traffic pages with "poor" scores.
To improve these metrics:
- LCP: Use modern image formats and a Content Delivery Network (CDN).
- INP: Reduce JavaScript execution times and streamline third-party scripts.
- CLS: Specify width and height attributes for images and videos to prevent layout shifts.
Backlink Growth and Referring Domains
While Core Web Vitals focus on on-site performance, your backlink profile measures off-site authority. Referring domains – the number of unique websites linking to your site – carry more weight than the total number of backlinks, as they signal broader industry influence. Each referring domain acts as a credibility boost in the eyes of search algorithms.
"Each referring domain is like a vote of confidence for our website. It is a high-impacting factor that contributes to our search optimization efforts." – Marc Lamber, Lamber Goodnow Injury Lawyers
Tracking link velocity, or the rate at which new referring domains are acquired, ensures that your backlink growth appears natural. Pay attention to the Domain Rating or Authority (scored from 1 to 100) of linking sites – links from high-authority sources are far more impactful than multiple links from low-quality directories. Additionally, for B2B reporting, focus on link relevancy – the proportion of backlinks from sites within your industry niche. This reinforces your authority as a subject-matter expert. Use Google Search Console to confirm that new backlinks are properly indexed.
For businesses seeking effective link-building strategies, Organic Media Group offers services to secure high-quality editorial links from relevant industry sources, helping you build measurable authority.
Competitive Intelligence Metrics
To truly refine your strategy, it’s not enough to monitor just your own metrics – you need to understand what your competitors are doing as well. Tracking your performance is only part of the equation. As SEOSolved aptly puts it:
"search is a zero-sum game: every click your rival earns is one you didn’t".
Competitive intelligence metrics help you figure out where you stand in the market, what opportunities your competitors are capitalizing on, and how to close the gap. These insights turn abstract rankings into actionable strategies.
Competitor Keyword Rankings
A key part of competitive analysis is understanding which keywords your competitors rank for that you don’t. This process, called keyword gap analysis, compares your domain to 3–5 competitors to uncover two types of opportunities:
- "Missing" keywords: Keywords where competitors rank, but you don’t.
- "Untapped" keywords: Keywords where some competitors rank, but others don’t.
These keywords are prioritized based on traffic lift – how much visitor traffic you could gain by surpassing a competitor’s ranking. Pay special attention to "striking distance" keywords, where you rank in positions 11–20 but competitors hold higher spots. These often require only small tweaks to move up.
For B2B SEO, segment keywords by intent – Informational, Commercial, or Transactional. This ensures you’re competing effectively at every stage of the buyer’s journey. Considering that 71% of B2B customers begin their research with a generic Google search, broad visibility across these categories is essential.
Also, monitor SERP features like Featured Snippets and "People Also Ask" boxes. Competitors who dominate these areas can provide clues on how to structure your content to claim these high-visibility spots. Reverse-engineer their use of tables, lists, and concise answers to improve your chances.
Content Gap Analysis
Content gap analysis identifies topics your competitors cover that you don’t. By studying "Top Pages" reports, you can pinpoint their best-performing content and analyze its type, depth, and format. While page-one content often exceeds 1,400 words, quality matters more than length – you need to address searchers’ questions better than anyone else.
Group missing keywords into topic clusters to spot broader areas where competitors have established authority. For example, if rivals rank for variations of "enterprise software implementation challenges" and you lack content on this topic, it’s a clear opportunity to create a dedicated resource. This ties directly to the idea of aligning SEO with business goals – filling these gaps can boost lead generation and impact your sales pipeline.
Additionally, track when competitors update their high-performing pages. Google favors fresh content, so failing to refresh your own pages while competitors continually improve theirs can leave you at a disadvantage. While keyword and content gaps point to areas for new content creation, analyzing backlink strategies takes your competitive insights even further.
Backlink Acquisition Rate
Backlinks remain a cornerstone of SEO, and monitoring your competitors’ link velocity – how quickly they acquire new backlinks – can reveal what’s needed to stay competitive. A link gap analysis highlights domains that link to multiple competitors but not to you, giving you a clear list of potential outreach targets. As Moz explains:
"Websites that link to your competitors have already demonstrated that they’re interested in your topic".
Study competitors’ most-linked pages to identify which types of content – like data reports, interactive tools, or in-depth guides – attract the most backlinks in your industry. You can also track journalists and publications that frequently cite your competitors to build a focused PR outreach list.
When comparing backlink metrics, normalize the data using size-adjusted ratios. For example, measure referring domains per 100 indexed pages. A startup with 500 pages and 200 referring domains (40 domains per 100 pages) might have stronger link velocity than an enterprise site with 10,000 pages and 1,500 referring domains (15 domains per 100 pages). For businesses looking to scale their backlink growth, Organic Media Group offers services to secure high-quality editorial links from industry-relevant sources.
Reporting Best Practices
B2B SEO Metrics Framework: Leading vs Lagging Indicators
When it comes to SEO, the numbers don’t just speak for themselves – they need a translator. Your reports should turn technical data into actionable insights that resonate with business leaders. While you might care about rankings and impressions, B2B stakeholders are focused on metrics like pipeline growth, revenue, and ROI. The challenge is presenting data in a way that bridges this gap without overwhelming decision-makers.
One common pitfall? Treating all metrics as equally important. Not all numbers serve the same purpose. Some predict what’s ahead, while others reflect past performance. Knowing the difference helps you avoid overemphasizing vanity metrics and ensures you catch early signs of trouble.
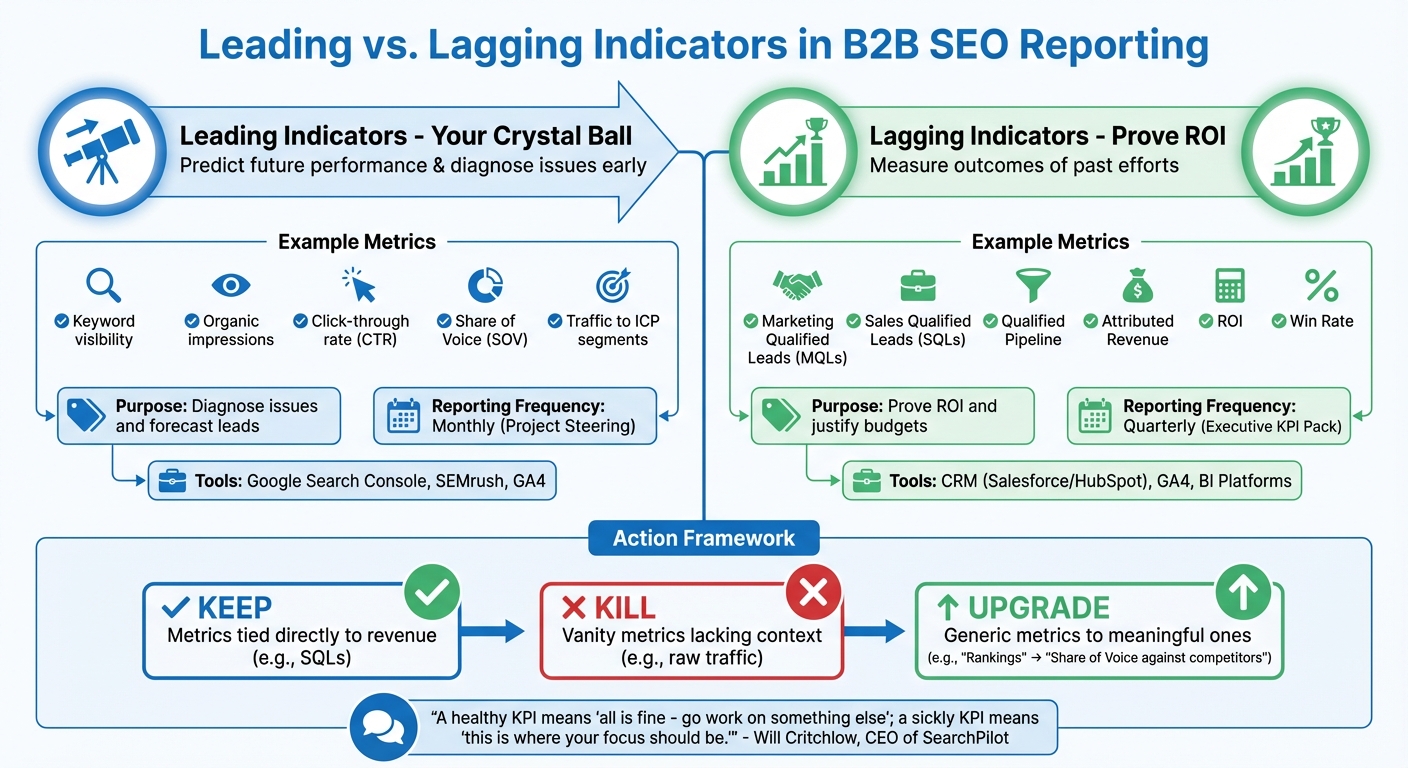
Leading vs. Lagging Indicators
Metrics fall into two main categories: leading indicators and lagging indicators.
- Leading indicators are your crystal ball. They highlight what’s working right now and give you a sense of what’s coming next. Think of them as your early warning system for potential issues.
- Lagging indicators look backward. They measure the outcomes of past efforts, proving ROI and justifying budgets, but they won’t help you fix current problems.
As Will Critchlow, CEO of SearchPilot, puts it:
"A healthy KPI means ‘all is fine – go work on something else’; a sickly KPI means ‘this is where your focus should be.’"
Here’s how these indicators break down:
| Metric Type | Example Metrics | Purpose | Reporting Frequency | Tools |
|---|---|---|---|---|
| Leading | Keyword research and visibility, Organic impressions, CTR, Share of Voice, Traffic to ICP segments | Diagnose issues and forecast leads | Monthly (Project Steering) | Google Search Console, SEMrush, GA4 |
| Lagging | MQLs, SQLs, Qualified Pipeline, Attributed Revenue, ROI, Win Rate | Prove ROI and justify budgets | Quarterly (Executive KPI Pack) | CRM (Salesforce/HubSpot), GA4, BI Platforms |
To keep your reports sharp, use a "Keep, Kill, Upgrade" approach:
- Keep metrics tied directly to revenue, like SQLs.
- Kill vanity metrics that lack context, such as raw traffic numbers.
- Upgrade generic metrics into more meaningful ones. For example, replace "Rankings" with "Share of Voice against competitors" or "Total Traffic" with "Traffic to ICP Segments."
For new campaigns where revenue hasn’t kicked in yet, focus on leading indicators to show progress. This "forward-looking reporting" approach reassures stakeholders that momentum is building, even if closed deals are still on the horizon.
Customizing Reports for Decision-Makers
Not all stakeholders care about the same metrics. A one-size-fits-all report risks leaving everyone unsatisfied. Instead, tailor your reports to address what each decision-maker values most:
- Your CEO wants to see how SEO contributes to business growth.
- Your CFO is focused on cost efficiency and ROI.
- Your CMO needs evidence that organic search is driving brand authority and filling the pipeline.
As Jess Jurva, Chief Customer Officer at Conductor, advises:
"Ask yourself: if the C-suite only takes one thing away from your presentation, what do you need them to know? Lead with this."
Here’s a quick guide to aligning metrics with stakeholder priorities:
| Stakeholder | Key Priorities | Recommended Metrics |
|---|---|---|
| CEO | Growth & ROI | ROI, SQLs, Market Share |
| CFO | Efficiency & Costs | CAC, Budget Efficiency, ROI vs. Paid |
| CMO | Brand & Conversion | Conversion Rates, Brand Authority, Pipeline |
| Content Team | Engagement | Top Performing Pages, Content Gaps, Dwell Time |
When presenting, avoid technical jargon. Translate SEO terminology into business-friendly language. For example:
- Instead of "SERP rank", say "Organic search performance."
- Frame "Backlinks" as "Votes of confidence from reputable websites."
- When discussing Core Web Vitals, connect it to results, like "Speed improvements contributed to an 18% increase in conversion rate."
Use Month-over-Month (MoM), Quarter-over-Quarter (QoQ), and Year-over-Year (YoY) comparisons to provide context. This helps stakeholders understand normal fluctuations and builds trust in your strategy.
For B2B companies with long sales cycles (4+ months), multi-touch attribution is crucial. Highlight how SEO supports deals throughout the buyer journey. Distinguish between:
- SEO-sourced opportunities: where organic search was the first touchpoint.
- SEO-assisted opportunities: where organic content played a supporting role later in the process.
Finally, pre-brief key executives before formal meetings. This one-on-one time allows you to address concerns and gain their support, making your main presentation far more impactful.
Conclusion
Numbers tell part of the story, but B2B SEO reporting only works when it ties search engine performance directly to your sales pipeline. Sure, tracking organic impressions can be helpful, but the real value lies in understanding how those impressions turn into MQLs (Marketing Qualified Leads) and SQLs (Sales Qualified Leads). That’s where the true ROI of your SEO investment becomes clear.
As Terrence Ngu from Hashmeta wisely points out:
"Ranking #1 for dozens of keywords means nothing if those rankings don’t translate into business growth".
The metrics that truly matter are the ones that demonstrate a commercial impact – things like qualified pipeline value, attributed revenue, and win rates. And with organic search accounting for around 53% of inbound leads in B2B and 44.6% of all B2B revenue coming from SEO-driven traffic, there’s a huge opportunity for businesses that measure their efforts effectively.
Rather than celebrating vanity metrics like traffic spikes, focus on what drives business growth: pipeline value, revenue attribution, and conversion rates. A "Keep, Kill, Upgrade" approach can help: keep the metrics that matter, cut the ones that don’t, and refine raw data into actionable strategies. It’s worth noting that SEO and inbound leads close at a rate of 14.6%, compared to just 1.7% for outbound leads. That’s a clear indicator of the quality SEO can deliver when done right.
For businesses finding it hard to connect SEO efforts with tangible results, partnering with a specialized agency can make all the difference. Organic Media Group excels at turning technical SEO wins into meaningful business outcomes. From link building to on-page SEO and content marketing, their expertise ensures your SEO initiatives translate into not just traffic, but also pipeline growth and revenue.
FAQs
Which 3 SEO metrics matter most to B2B executives?
For B2B executives, the most important SEO metrics boil down to SEO ROI, organic traffic quality and volume, and lead generation metrics. Why? Because these metrics directly connect SEO efforts to tangible results like increased revenue and higher-quality leads. They’re the clearest way to show how SEO contributes to achieving critical business goals.
How do I tie organic SEO to pipeline and revenue?
To tie organic SEO efforts directly to your pipeline and revenue, prioritize metrics that impact revenue, such as pipeline contribution, customer acquisition cost (CAC) efficiency, and lifetime value (LTV). Leverage tools like analytics platforms, attribution models, and CRM systems to create a clear connection between SEO strategies and tangible business results. These resources help showcase how SEO contributes to generating leads, driving conversions, and boosting revenue.
What’s the best attribution model for B2B SEO?
When it comes to B2B SEO, selecting the right attribution model hinges on understanding your customer journey and the importance of recognizing multiple touchpoints. Omnichannel attribution models are particularly effective for highlighting SEO’s impact at every stage – awareness, consideration, and conversion – especially in the intricate sales cycles typical of B2B. Similarly, multi-touch attribution models provide a comprehensive look at how SEO contributes to generating leads and driving revenue. Ultimately, the best choice is a model that aligns with your business objectives and captures the entire customer journey.